Introduction
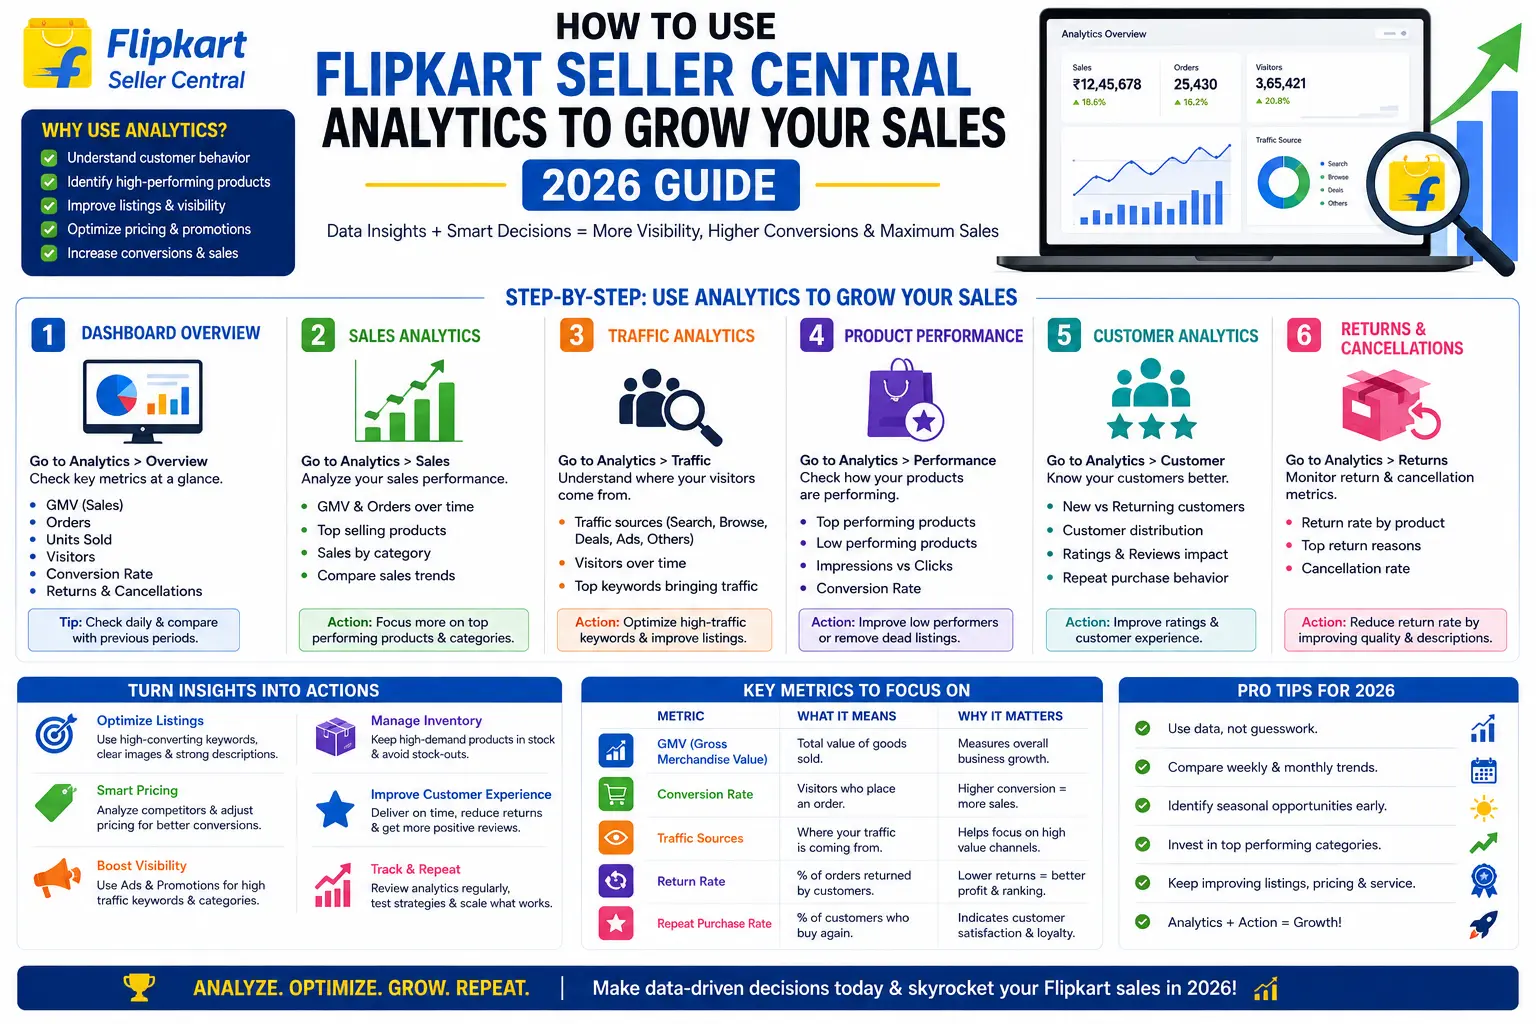
Flipkart’s Seller Central is a goldmine of data — when you know how to interpret it. Most sellers log in, glance at a sales number, and log back out without ever touching the reports that actually explain why that number moved. This tutorial-style guide shows you exactly which Flipkart Seller Central analytics reports to focus on, how to translate the numbers into specific actions, and the tactics that compound into real sales growth in 2026 when applied consistently rather than checked once and forgotten.
Quick Answer
The five metrics that matter most are Sessions & Impressions (visibility), Conversion Rate (efficiency), Average Order Value (upsell potential), Buy Box Win Rate (competitiveness), and Return/Cancellation Rate (quality). Review them weekly, not monthly — sellers who catch problems within days fix them before they compound into ranking drops.
Step 1: Identify Your Key Performance Indicators (KPIs)
Before diving into reports, pin down the metrics that move the needle:
- Sessions & Impressions: Track visibility trends.
- Conversion Rate: Sales ÷ Sessions — your core efficiency metric.
- Average Order Value (AOV): Insight into upsell opportunities.
- Buy Box Win Rate: Determines how often you’re the default seller.
- Return Rate & Cancellation Rate: Flags product or fulfilment issues.
Action: In Seller Central, go to Performance → Business Reports and note these KPIs for the past 30 days as your baseline.
Analyze Traffic Sources & Category Performance
Search vs. Discovery
- Search Traffic: Customers using keywords on Flipkart’s search bar.
- Discovery Traffic: Browsing via category pages, banners, or recommendations.
Action: In Business Reports → Traffic Dashboard, compare Search vs. Discovery. If Discovery is low, optimize your category titles and browse-node placement.
Top-Performing Categories
Drill into Catalog → Category Performance to see which sub-categories yield the highest conversion rates.
Tip: Shift promotional budget or featured slots toward top-converting categories to quickly boost sales.
Deep-Dive into Listing Health & Conversion Funnels
Listing Quality Score
Flipkart scores listings on content completeness, image quality, and attribute accuracy.
Action: In Catalog → Listing Quality, identify your lowest-scoring products relative to your catalog average — check the exact scoring thresholds in your current dashboard rather than assuming a fixed cutoff, since this can vary — and update titles, bullets, images, and attributes on those first.
Tracking Lost Sales in the Funnel
If sessions and impressions are healthy but conversion is weak, the gap is usually pricing, shipping cost, or a trust signal missing from the listing rather than a traffic problem. Review your funnel data in Performance → Business Reports to see where in the process — product page view, add-to-cart, checkout — the drop-off actually happens, since the fix differs depending on which stage is leaking.
Fix: If drop-off is concentrated at checkout specifically, a limited-time coupon via Promotions → Coupons can re-engage price-sensitive shoppers who added to cart but hesitated.
Optimize Pricing & Promotions Using Margin Analytics
Price Elasticity Testing
Use Reports → Price Comparison to see how small price changes affect sales volume.
Action: Test a 5% price drop on slow-moving SKUs and measure lift in conversion over 2 weeks.
Promotion ROI
In Promotions → Performance, compare your top coupon campaigns by incremental sales versus discount cost.
Tip: Allocate more budget to the highest-ROI promotions and sunset underperforming ones. Our Flipkart Sales Boost service handles exactly this kind of ongoing promotion analysis if you’d rather not run it manually every week.
Monitor Inventory Turnover & Stock Health
Days of Supply
Check Inventory → Stock Health, focusing on DoS for bestsellers. Too low means stock-outs; too high ties up capital.
Restock Recommendations
Flipkart’s suggested restock quantities help maintain Buy Box eligibility.
Action: Set automated reorder alerts well ahead of your typical reorder lead time to prevent DoS from dropping below optimal levels — the exact percentage threshold that works best depends on your specific supplier lead times, so treat 30% as a starting point to test, not a universal rule.
Leverage Customer Feedback & Ratings
In Performance → Ratings & Reviews, identify products with below-average ratings relative to your catalog. Read low-rating feedback to spot recurring product or service issues.
Fix: Address common complaints — update product descriptions, improve packaging, or escalate quality control. Then request reviews from satisfied customers via Marketing → Feedback Requests.
Iterate with Weekly Analytics Sprints
- Set a Weekly Review: Every Monday, export your top KPIs and compare against the previous week.
- Run Hypothesis-Driven Tests: “If I improve listing quality, conversion will increase” — then actually measure it rather than assuming.
- Document & Scale: Any tactic that lifts sales — document the steps and apply it to your top 20% of SKUs.
This weekly habit is where meaningful sales growth actually becomes realistic — not from any single tactic above, but from compounding small, tested improvements consistently over months rather than treating this as a one-time audit.
Benchmark Against Competitors, Not Just Your Own History
Tracking your own week-over-week trend tells you whether you’re improving. It doesn’t tell you whether you’re improving fast enough relative to competitors selling similar products. Use the Price Comparison report alongside manual spot-checks of top-ranking competitor listings in your category — note their pricing, review count, and listing completeness. If a competitor is consistently winning the Buy Box on a product similar to yours, the gap is almost always one of price, fulfillment speed, or listing quality — and it’s usually visible once you actually compare side by side instead of assuming.
Read Your Analytics Differently During Sale Events
Flipkart’s major sale events — Big Billion Days and similar festival promotions — genuinely can produce outsized spikes in traffic and sales, and reading your normal weekly baseline against a sale-event week will give you misleading conclusions in both directions. A conversion rate that looks fantastic during a flash sale isn’t necessarily replicable the rest of the year, and a temporary dip in Buy Box Win Rate during a high-competition sale period isn’t necessarily a real problem with your listing. Keep a separate baseline for sale-event periods specifically, and compare this year’s event performance against last year’s same event, not against your regular weekly average.
Mistakes That Quietly Skew Your Analysis
Comparing absolute numbers instead of rates. More sessions with the same conversion rate isn’t necessarily progress if it’s just seasonal traffic — conversion rate and AOV trends tell you more about real improvement than raw session counts alone.
Reacting to single-week noise. One bad week isn’t a trend. Look for a pattern across at least 2-3 weeks before concluding a tactic failed or a metric is genuinely declining.
Ignoring category context. A 2% conversion rate might be strong in one category and weak in another — benchmark against your own category and product type, not a generic industry number pulled from somewhere else.
Testing multiple changes at once. If you change price, images, and title in the same week, you won’t know which change actually drove the result. Isolate variables where you can.
KPI Quick-Reference Table
| Metric | Where to Find It | What It Tells You |
| Sessions & Impressions | Performance → Business Reports | Visibility trend |
| Conversion Rate | Performance → Business Reports | Sales efficiency |
| Average Order Value | Performance → Business Reports | Upsell/bundle opportunity |
| Buy Box Win Rate | Performance → Business Reports | Competitive positioning |
| Listing Quality Score | Catalog → Listing Quality | Content completeness gaps |
| Days of Supply | Inventory → Stock Health | Stock-out / overstock risk |
| Ratings & Reviews | Performance → Ratings & Reviews | Product/service quality signals |
| Promotion ROI | Promotions → Performance | Which campaigns are worth repeating |
Frequently Asked Questions
What key metrics should I focus on in Flipkart Seller Central?
Start with Sessions & Impressions for visibility, Conversion Rate for efficiency, Average Order Value (AOV) for upsell potential, Buy Box Win Rate for competitive advantage, and Return/Cancellation Rates for quality control.
How often should I review my analytics reports?
We recommend a weekly analytics sprint — export your KPIs every Monday, compare to the prior week, and plan one data-driven test to implement by the next review.
What is the Buy Box Win Rate and why does it matter?
The Buy Box Win Rate indicates the percentage of times your offer is the default “Add to Cart” choice. A higher rate means more impulse buys and fewer lost sales to competitors on the same product page.
Can I use Flipkart's analytics to optimize pricing?
Yes. The Price Comparison report shows how small price adjustments impact sales volume. Test 3-5% price changes on select SKUs over 2 weeks to find your optimal price point — our Flipkart Fee Calculator is a useful companion for making sure any price test still protects your margin after fees.
How do I reduce stock-outs using Flipkart analytics?
Use the Days of Supply (DoS) and Restock Recommendations in the Stock Health report. Set automated alerts to reorder based on your typical supplier lead time.
What's the best way to handle low product ratings?
In Ratings & Reviews, filter for below-average feedback to identify recurring issues. Address them — update descriptions, improve packaging, or refine quality. Then use the Feedback Requests tool to gather new, positive reviews.
How can I measure the ROI of my Flipkart promotions?
In Promotions → Performance, compare incremental sales against the total discount cost for each coupon campaign. Focus your budget on the promotions with the highest sales lift per rupee spent.
Should I compare my sale-event performance to my regular weekly numbers?
No — compare sale-event performance (like Big Billion Days) against your own performance during the same event last year, since regular-week baselines will make the comparison misleading in either direction.